
One broken formula away from a panic attack?
If you're stitching together P&Ls from 12 entities in Excel for month-end… there's a better way.
Nominal is AI-powered financial consolidation for teams that have outgrown the manual grind.
It plugs into your ERP(s), automates intercompany eliminations, and gives you real-time financials without spreadsheet sorcery.
No more version control nightmares. AI agents handle journal entries and reconciliations so you can close the books in hours, not weeks.
Book a demo if your finance team is ready to ditch spreadsheets for good.

Chain reaction
Early in my career, I worked in a business with thousands of operating units.
For a while, my job was to run the team that produced the balanced scorecard each month for each of those units.
It was a tough job.
We went to press each month on working day 7 with individual dashboards. One for each location. The financials only closed on working day 5. Giving us 2 days each month to produce over 3,000 dashboards across 4 levels (location, region, business unit, corporate).
That included 21 KPIs (yes, too many) needing more than 50 data inputs from across the business: actual, target, and prior year, for the month and year to date.
And in those days? All managed through a complex MS Access database.
It was as hard as it sounds. But forget risk and technology for a moment.
This was 20 years ago, and in those days the ability to produce accurate scorecards for that many outlets was a competitive advantage. Regardless of how it got done.
Our competitors were not able to do it. They could manage in total, or by region, but not as fast. We executed harder in a hyper-competitive market.
The sponsor for this was the COO. A peculiar man who didn’t like his silences interrupted (sometimes these ran well over 60 seconds).
In those days, he ran an operation of over 200,000 people. He could get them to move mountains. Extraordinary for a man of so few words.
He has since become the CEO of a $30bn revenue business. A big dog.
He rarely said a word to me. But he did once say this:
“To succeed in our business, we have to control the business. Control starts with people and ends with profit. If our people are happy, they will deliver a consistent operation. If the operation is consistent, our customers will love us. If our customers love us, profit will take care of itself. And if our profits are ok, we’ll deliver a return on investment to our shareholders. We need to measure every link in that chain.”
From that point, I looked at balance scorecards with fresh eyes.
He described profit as a lagging indicator to a bunch of non-financial leading indicators. With people metrics as the lead KPIs. I no longer saw it as a scattering of KPIs from different functions.
I now saw it as a chain.

Metrics that matter
Welcome to the final week of this series on reporting business performance.
In the first week, we defined what reporting is and why it exists
In the second week, we discovered how to use storytelling to 10x the impact of reporting
And last week, we set out the 8 Rs to turn the principles into a reporting cadence
But the cornerstone of your reporting cadence is in ensuring you have the right metrics.
We are going to get into how to define the right KPIs for your business.
But first, let’s start with a history lesson.
The History of KPIs
Whilst the language of KPIs and Scorecards emerged 30 years or so ago, the principle is age-old. In the Stone Age, cavemen would make notches on a rock for each animal they killed.
We’ve come a long way.
Modern accounting systems have been built on our beloved double-entry bookkeeping. But the first idea of ‘dashboards’ emerged in the early 1900s, when French scholars built the first 'Tableau de Bord' to measure efficiency.
You’d have to wait until the 90s before KPI became common business parlance.
But what exactly is a KPI?
There are a few definitions, but the best I have found is this:
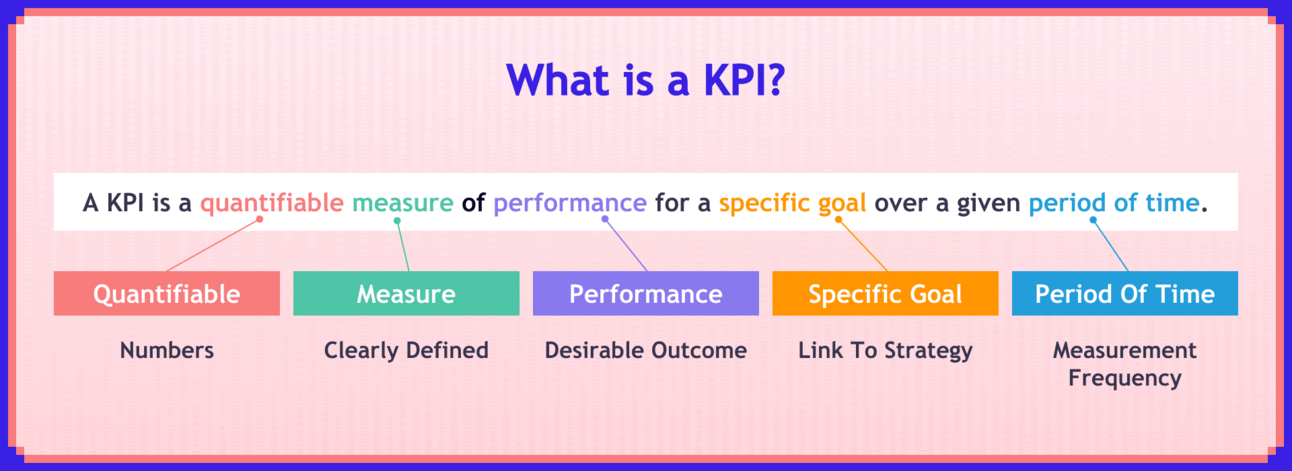
Pretty close to the classic SMART objective, right?!
But how do you turn that into a smart suite of KPIs?
I used seven steps twenty years ago when managing this process for a global mega corp. And the principles still stand up today:
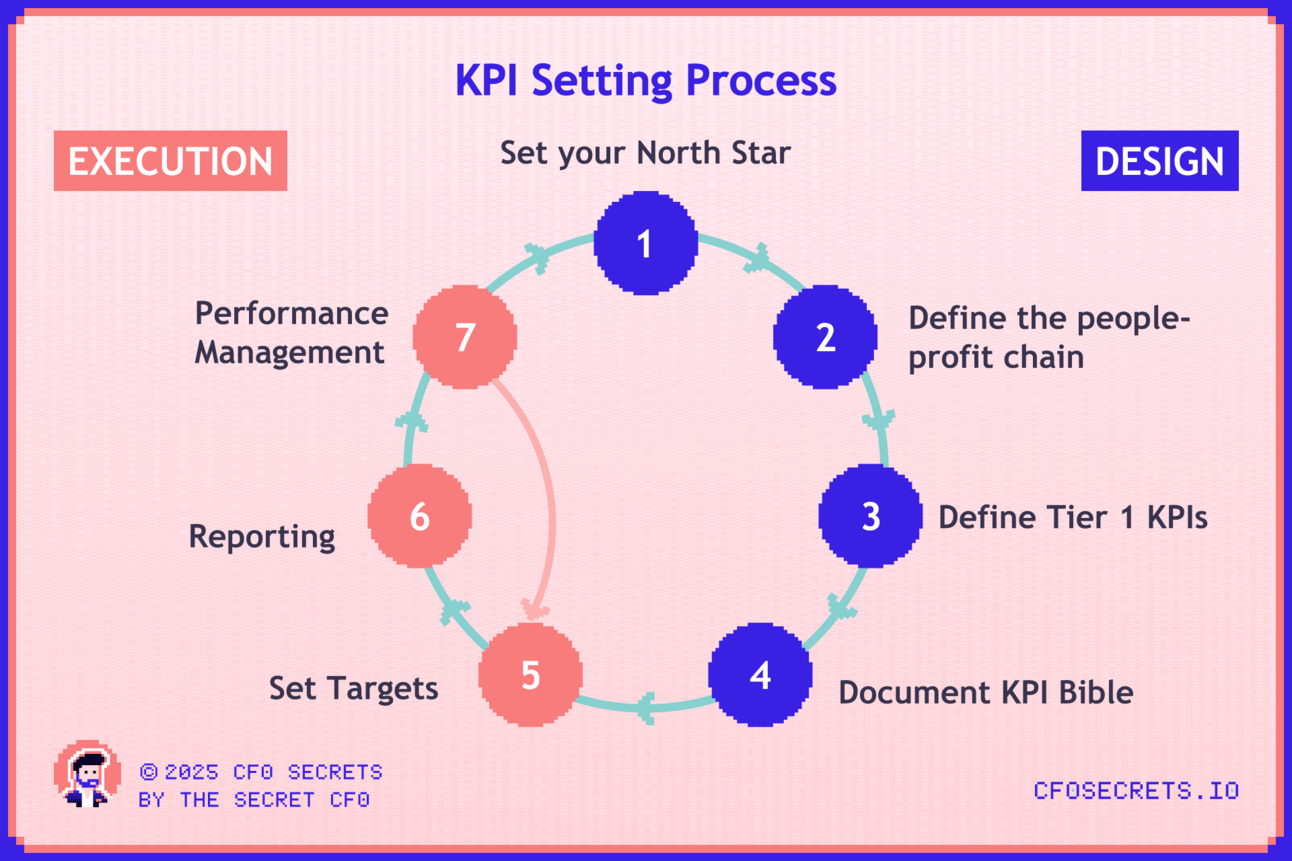
Like anything, they start with strategy….
Step 1 - Set your north star
For these purposes, we’ll assume you have a clearly defined strategy. This process is hard without it.
From that, you should be able to identify one north star KPI for your business, and a goal to go with it. The one measure that drives value more than any other.
Some examples:
In a SaaS business, it could be to hit $100m ARR
In a PE backed business, it could be to hit EBITDA of $20m or a free cashflow measure
And as you guys know, I like using MFCF
Note: These north star measures are simple. Big round number targets.
With that one measure in place, then define 3–5 hero measures that support (and counterbalance) the North Star. Together they should representing how your business creates shareholder value.
For CFOs, ensure these Tier 1 KPIs are explicitly mapped to board-level strategic objectives and executive compensation metrics. These KPIs are not just financial or even operational. They’re your investor narrative and incentive model.
Some examples:
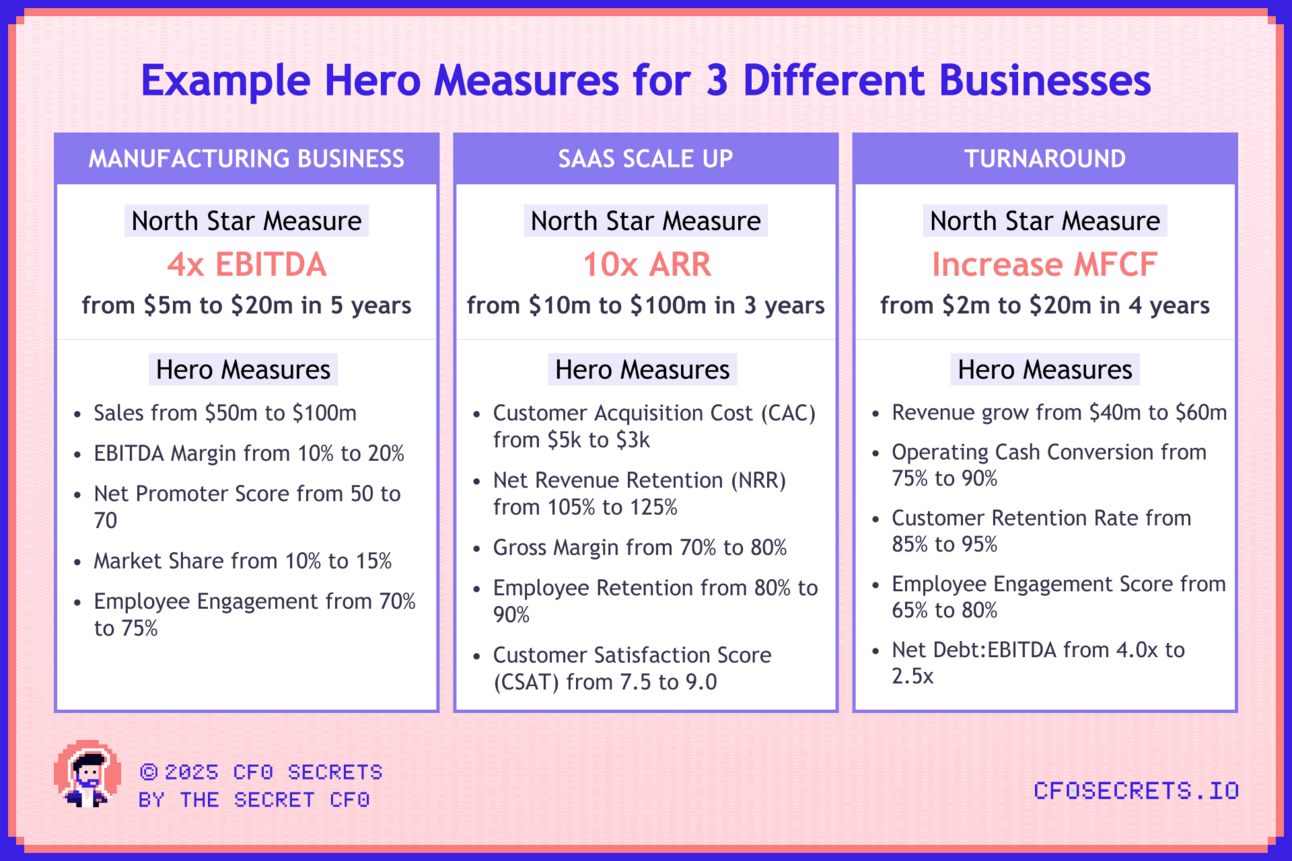
Notice how these are outcome measures? That makes sense for longer-term/strategic goals. We’ll get to more leading indicators shortly.
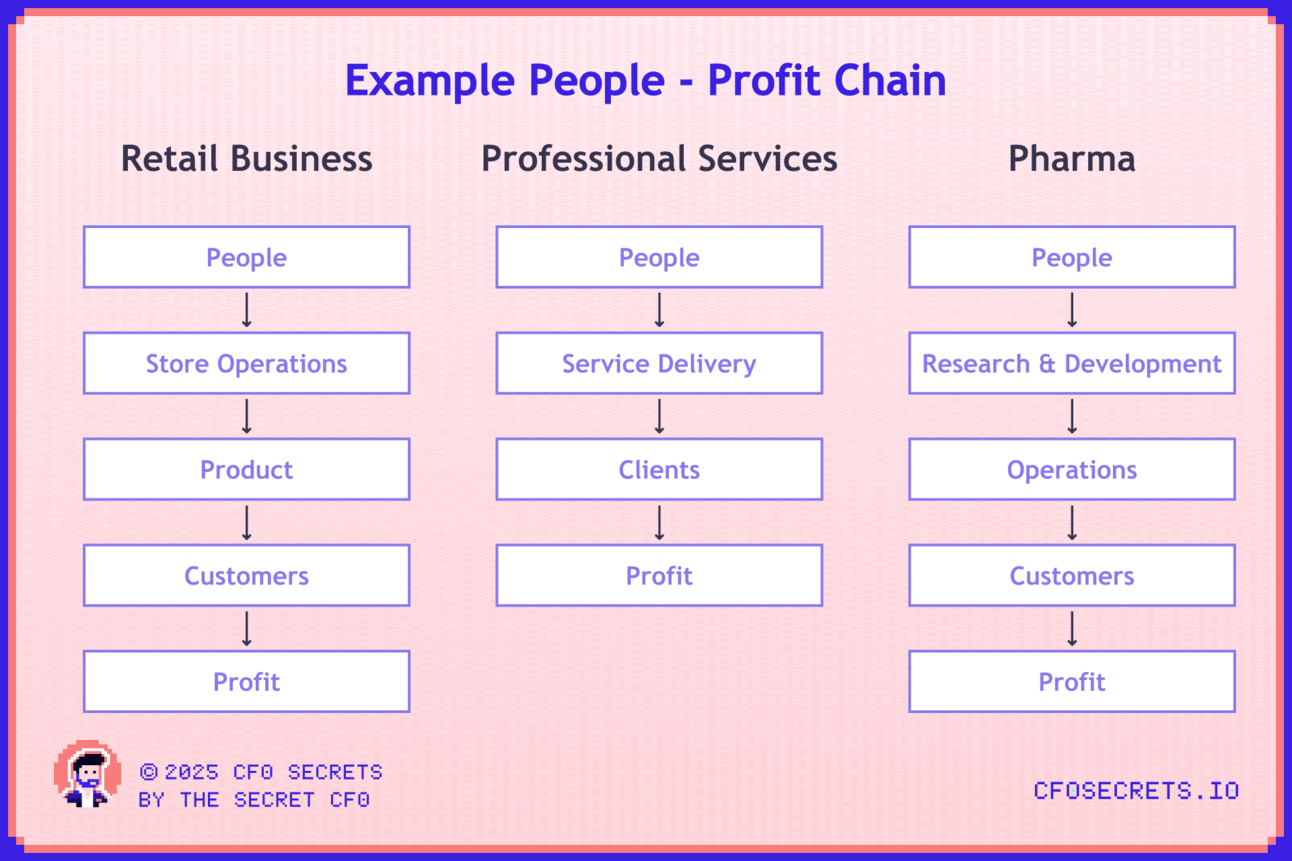
Step 2 - Define your people-profit chain
With your direction set, you should be able to design your people-profit chain. These should not be KPIs, but should define areas or groups of KPIs.
Examples:
Step 3: Define Tier 1 KPIs
Next, we define Tier 1 KPIs. These become the first tier of operational KPIs. The kind of things your exec would talk about at a monthly business performance review.
You ideally want 12–14 KPIs, but anywhere from 8-20 can be ok, depending on the circumstances. So you are looking for 2-3 per area you defined in Step 2.
And you already have a few of them (your hero measures from Step 1).
They should work together and go to the heart of what makes success in the business. With a nice balance of leading indicators and lagging indicators.
Here are some common tier 1 KPIs:
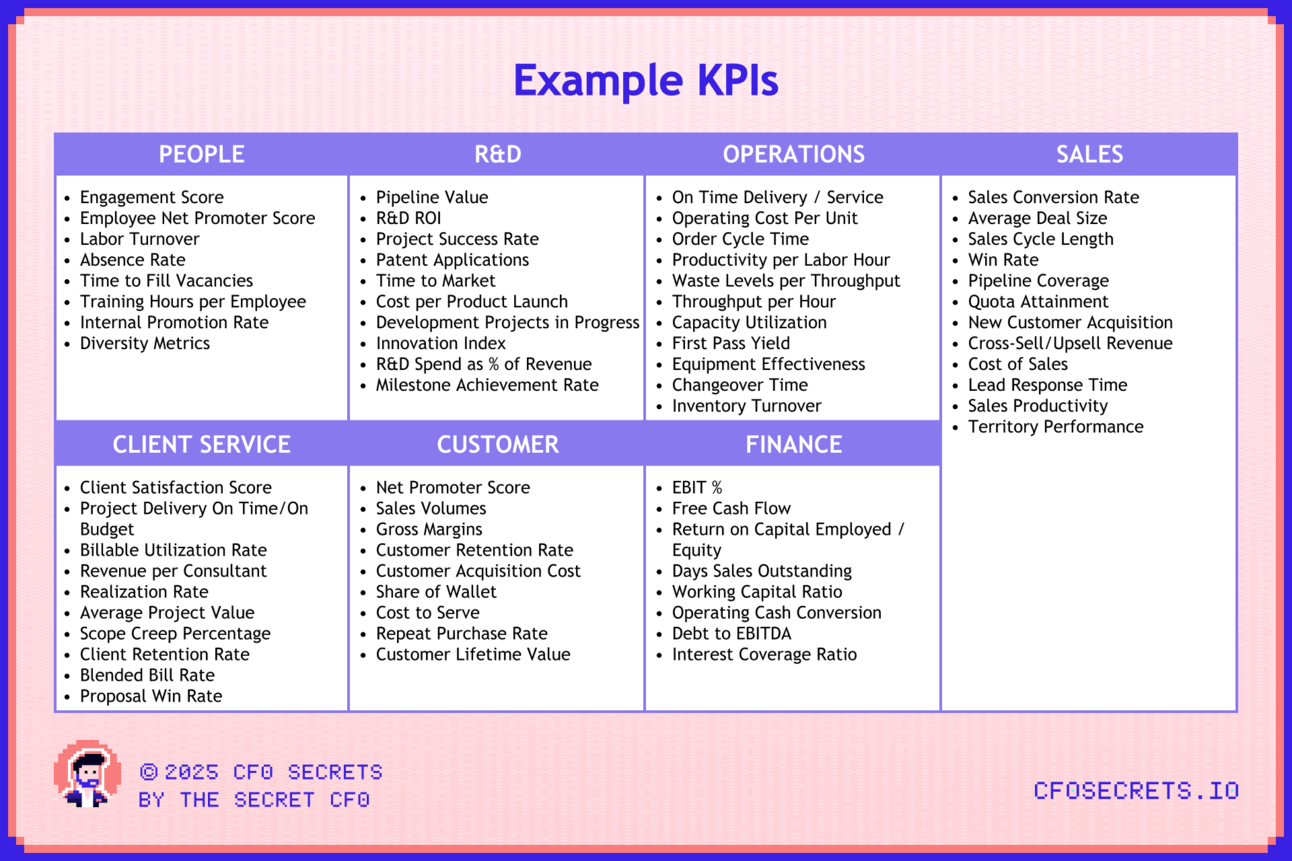
Once you’ve selected your tied 1 KPIs here’s a good way to test if any are missing. Ask yourself the following 2 questions:
If all of these KPIs were green, would that be enough? Are there any circumstances in which you would be unsatisfied with performance?
Can you neatly follow the People to Profit chain without a link broken?
Step 4: Create KPI Bible
You have decided which KPIs are important. Now you need to agree on how to measure them.
Any KPI output is a product of inputs and calculations.
You need to document this clearly for each KPI:
Input data
What data is needed?
For what period?
From what source?
Who is responsible?
Calculations
How is the KPI calculated?
How does that change at different levels of the hierarchy?
Who performs the calculation?
In what system is the calculation performed, and where is it stored?
How frequently is it measured?
Output
Who is the business owner of the KPI?
Who reviews the output before it's published?
How are targets set?
Are any financial measures departures from GAAP, and how and when are they reconciled?
How, where, and when is it published?
The detail is important here. I have seen a criminal amount of time wasted with a lack of clarity and ownership of KPIs and data sources. And the real crime is that the discussions are perpetually about the data, rather than driving performance.
Let’s break one down. Take ‘labor churn’:
What period do you measure the churn: 1, 3, or 12 months?
Do you count contractors and off-payroll staff?
Do you use data from the payroll system or the employee management platform? Why don’t they reconcile?
How do you calculate the denominator? Start of period actual? Average of the last 12 months? Average of the calculated churn period?
Do all operating units get the same target?
Do you want to measure the churn of the last 12-month joiners and total employees separately (to isolate fast-churn)?
Does HR calculate this themselves? Or do they provide the data to the reporting team to calculate it?
It doesn’t matter what the answer is.
But it does matter that these questions get asked and answered. And get documented precisely.
You are creating the GAAP accounting manual for KPIs. Like all policies, it needs ownership. Assign a KPI steward, typically the FP&A lead or a performance analyst, responsible for the quarterly review and update. This was me in more than one business in my early career. I loved it - I had an evergreen hall pass to talk to anyone in the business.
Where KPIs link to incentive plans or external reporting, build in an audit trail. Assume every number will be challenged. Your job is to make sure you win those debates with documentation.
Step 5: Set targets
For each of your Tier 1 KPIs, you should have a long-term target. Lofty and aspiring, but achievable.
You must define the time frame. 3–5 years is typical.
It all starts with your north star KPI right back in Step 1. That is your BHAG (Big Hairy Ass Goal). It is also your most ‘lagging’ KPI.
It then becomes easier to set a long-term target for the rest of the Tier 1 KPIs, which should walk you through your people-to-profit chain all the way to your north star goal.
And once you have those long-term goals for each KPI, you can break them down into a ‘year 1’ target for each. Then, finally, you can break that back by reporting period (monthly). And, if necessary, into operating units.
Best practice is to fold the KPI target setting into the budget process. KPIs and financials are not separable, so how do you plan for one without the other?
Step 6: Set up reporting
You have a clearly defined set of tier 1 KPIs. And a monthly target by operating unit. Those targets ladder up to connect to 3-5 year strategic goals.
Now we need to set up the reporting so we can track performance.
I like to anchor all KPI management around a Monthly Corporate Dashboard. Think of it as part of your monthly financial close.
I use something that looks like this:
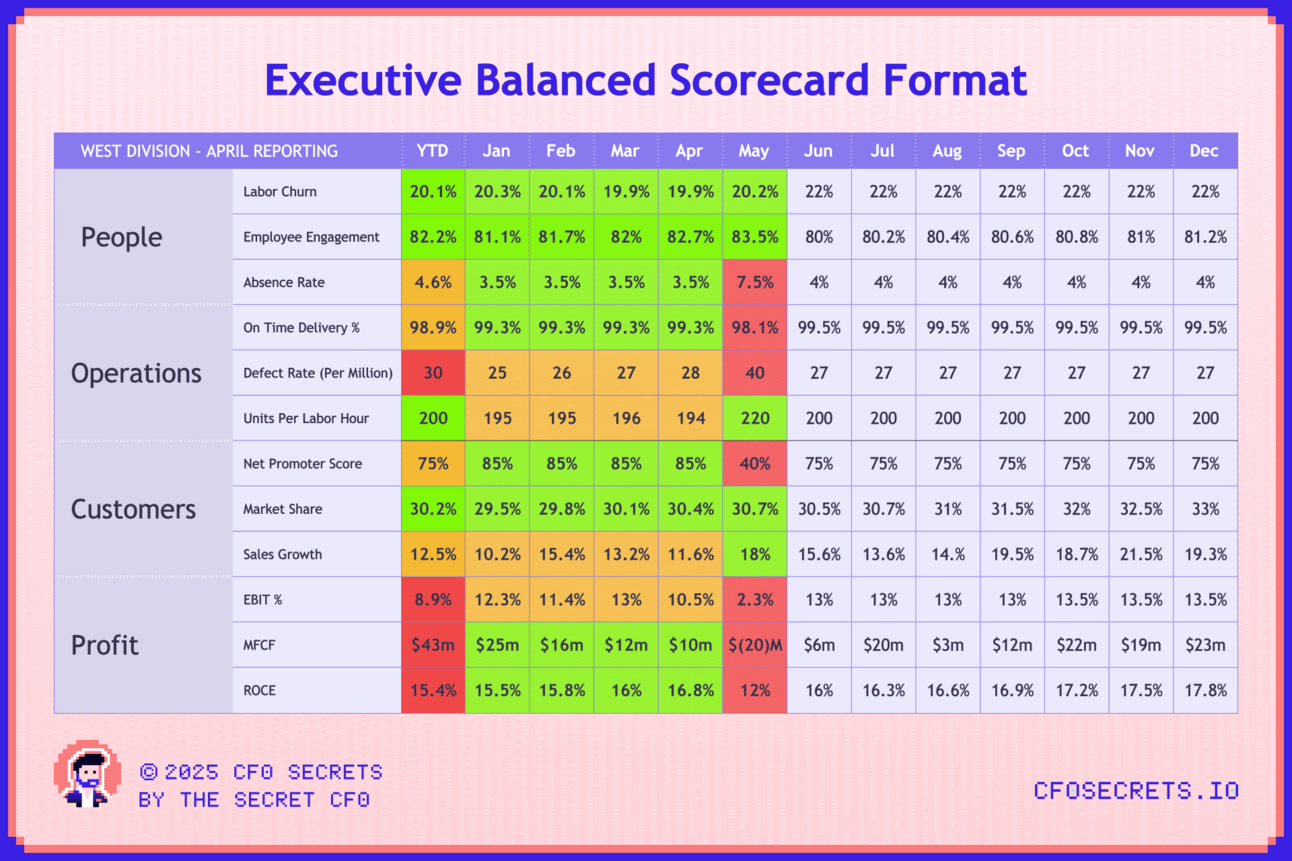
I tend to RAG measures as follows:
Green: Better than target.
Amber: Worse than target, but better than last year or a threshold
Red: Worse than target and last year
In the above example, you can see a clear story of a division in the business that is driving to meet a sales growth and EBIT target. They have pushed their loyal staff too hard, which in May has resulted in high absenteeism. That led to an increase in defect rate and angry customers (Net Promoter Score). And the financials are a bloodbath as a result.
The remedial action becomes much clearer. Exposed by the People-Profit Chain.
This single page format also becomes your perfect story of the ‘business on a page’ for the board. And it raises the altitude of board discussions to a broader definition of value creation.
I’ve seen people try and use more visual or complicated versions of this dashboard. But I’ve never seen anything that works as well as this for anchoring an exec team and board around what is important.
Monthly is not fast or frequent enough for your operational teams of course; they will need real time, daily and weekly KPIs. BUT … all KPIs should cascade from this monthly anchor (more on this in a moment.)
Step 7: Performance management
To complete the loop, you mustn’t stop at reporting.
There must be a formalized channel for discussing KPI performance and driving improvement.
You want Steps 2 to 6 as slick and automated as possible. Delivering the right KPIs in the right place at the right time.
This maximizes the time spent in Step 7, where customers are satisfied and money is made.
CFOs who are still stuck debating KPI definitions or data lineage deep into Q2 aren’t ready to lead performance. That’s not finance leadership, it’s reporting admin with a title upgrade. Do it once. Codify it. Automate the hell out of it. Move on. Monthly Performance Reviews are the epicentre of where performance gets improved.
These aren’t just check-ins, they’re the forums for decision-making, resourcing, and accountability.
Codify your exec performance calendar:
Monthly: KPI Review with the executive team
Quarterly: Strategy/KPI alignment + target reset
Annually: Integration with compensation and planning cycles
Each red KPI must have an owner, an action plan, and a resolution timeline. Don’t let reporting become a mirror. Use it as a steering wheel.
We will cover monthly performance reviews in more detail in our upcoming FP&A series.
Beyond Tier 1
Once you have cracked these seven steps for tier 1 KPIs, you have the anchor scorecard for the business (by operating unit). This should drive performance conversations, personal objectives/OKRs, bonuses, etc.
But to get a true cascade through the business, you will need to go further than tier 1. And you’ll certainly need to measure more frequently than monthly.
Revenue Per Labor hour might be a good measure monthly at tier 1. And it’s a fantastic measure of the trading efficiency of a business. But it’s a lagging measure, and it’s hard for any one department to own it 100%.
So you might need to introduce two tier 2 KPIs:
Revenue per unit (owned by sales)
Units Per Labor Hour (owned by ops)
You could then break down Revenue Per Unit into tier 3 KPIs by Sales Channel or Product Category. These could then be attached directly to individual sales managers.
Measure Units Per Labor Hour by individual operational departments, creating another set of Tier 3 KPIs.
Done well, you end up with a pyramid of KPIs covering 3 management tiers, each with its own review forum:
Tier 1 (Enterprise KPIs) → Executive Committee
Tier 2 (Function/BU KPIs) → Business Unit Reviews
Tier 3 (Operational KPIs) → Departmental Reviews
Governance drives action. Define when each KPI is reviewed, by whom, and on what frequency.
Two warnings, though:
Adding tiers gets complex FAST. So be ruthless about what you add. A simple control against chaos is to mandate that any change to the KPI bible (including adding new KPIs) must be signed off by you as CFO. And say no, more than yes.
You must only start on tier 2 and tier 3 KPIs once you have all 7 steps working seamlessly for tier 1 KPIs. I have seen many KPI projects fail under the weight of an over-ambitious initial scope.
SpaceX Example
SpaceX is a good example of where this framework was used to create ambitious breakthrough innovation targets.
They have set a north star KPI to deliver an improvement of over 100x in the cost per payload for a trip into space. With that north star set, it gave birth to a bunch of other creative KPIs. Most famously, the ‘Idiot Index.’
I wrote about it here:
In the comments to that post are a bunch of people picking apart the technical flaws in the measure, i.e., where is the labor attribution or overhead allocation, etc. This is classic accountant thinking, and I want you to be better than that. This works precisely because it distrusts conventional costing methodology.
Not only that, but it’s the perfect measure for a business that is reengineering a whole supply chain at warp speed.
And if you wanted proof:
The idiot index wouldn’t work in most businesses, but it’s perfect for SpaceX. Perfect evidence that it’s fine to be creative with one or two tier one metrics that are bespoke for your business. Just don’t overcomplicate them.
Net-net
And with that, ladies and gents, we come to the end of this series on performance reporting.
There are some things we haven’t covered: bridging performance, connecting operations to financial performance, forecasting/reporting forward-looking information.
Don’t worry… it’s all coming in next month's 9-week super series on FP&A… LFG!

If you’re looking to sponsor CFO Secrets Newsletter fill out this form and we’ll be in touch.
Find amazing accounting talent in places like the Philippines and Latin America in partnership with OnlyExperts (20% off for CFO Secrets readers)
:::::::::::::::::::::::::::::::::::::::::::::::::::
:: Thank you to our sponsor ::
:: NOMINAL ::
:::::::::::::::::::::::::::::::::::::::::::::::::::
What did you think of this week’s edition?

If you enjoyed today’s content, don’t forget to subscribe.


