


Orb future-proofs your business with the billing engine designed to grow with you.
Usage-based pricing is becoming more common, but without the right tools, finance teams are left to hold the bag. Orb automates billing and invoicing for any pricing model at any scale so that finance teams can keep moving at the speed of their revenue.


“Great chat”
“Let me tell you why I fired the last guy.”
It was my first day as Head of FP&A working for this eccentric, ultra-successful founder.
And these were the first words he said to me.
Before he continued, I knew exactly what the message was: “If you repeat the mistakes of your predecessor, you’ll be gone before you’ve even booted your laptop.”
At least I knew where I stood.
Anyway… I was immediately curious:
“OK, let me hear it, what did he do?”
“His answer to everything was to put prices up. If costs went up he’d say put prices up.”
“Well, that sounds sensible enough.”
“... I hadn’t finished. If costs went down, he’d say put prices up. If we had operational issues, he’d say put prices up. New competitor, prices up. Failed product launch, price it up. If our customers reported good earnings, do you know what he wanted to do?
“... let me guess. Put prices up?”
“Yep. Glad you are listening. Imagine that? Our customers choose us as a partner. Use our products to win in their markets. And we reward them by hiking prices.”
This was an extraordinary level of customer obsession. I’d never seen anything like it. Mind you, this guy had been wildly successful. A billionaire many times over. He, for sure, knew a ton of things I did not.
I decided the best tactic was to deploy my newly honed active listening skills:
“Sounds like your customers are important to you?”
“Yep. They are my babies. I hate putting my prices up. HATE IT. We only put our prices up once we’ve tried everything else. And I mean everything. And even then, we put our prices up six months after our competitors do the same.”
This seemed to flip everything I knew about business on its head. How had someone so allergic to gross margin become so wildly successful in business?
I leaned in as he continued:
“You see. We do not control our prices. The market sets our prices. We control our costs, not our prices. As long as our unit costs are the lowest in the market, it doesn’t matter what the sales prices are. We will win. Even if I have to wait forever. I’ve got forever. We’ll be the last one standing.”
Then he jumped up, opened his door, and ushered me out.
“Great chat, great chat. You are going to do great here. Just keep my prices down.”
I’d barely said anything in our ‘chat’ but at least the active listening had worked (thank you, Chris Voss).
The whole exchange lasted less than 5 minutes, but it was gold.
Then 10 seconds later, as I was heading back to my desk his door swung open, and he shouted:
“HEY. IF YOU SEE ANYONE PUTTING MY PRICES UP, LET ME KNOW. I’LL F*CKING KILL THEM.”
He let out a maniacal laugh, before letting his door close.
As I sat down, my next-door desk neighbor said, “I see you got the pricing policy induction. Everyone who joins gets the same routine.”
I had a feeling I’d like it here.

This is the second part of a three-part series on unit economics.
Pulling the Right Lever: How to Drive Unit Economics in Your Favor
Last week we covered some fundamentals of unit economics.
Mostly theory.
And the theory mostly addresses individual components of the P&L in isolation.
Should you put prices up or down
Reducing variables costs
Improving fixed cost per unit by increasing volumes
Etc.
But in practice, the P&L is rarely a simple linear model. It is connected in many ways that are impossible to see purely from the accounting.
You can improve fixed cost per unit with higher volumes. But you might have to drop your prices to win that volume. And maybe you don’t have the labor you need for those volumes. So you pay higher rates, increasing variable costs per unit.
In a well-managed business, there is rarely a ‘free lunch’ in the P&L. There is a chain reaction of second-order and third-order effects. Especially when you account for competitor response.
It’s a complex game of whack-a-mole.
So this week we will get into unit economics in practice.
And that means leaving the accounting at the door to focus on how P&Ls behave in the wild. Plus, the levers you can pull to drive them. Those levers should align to where and how they are controlled in a business rather than where they sit in the P&L.
Gross margin is a great example. In most businesses, nearly every part of the business has some influence on gross margin. So you have to break down gross margin into its component drivers. Then you can have a plan around each driver.
To take a simple example. Walmart’s gross margin is 25%. That is controlled by the merchandising/product team who will determine what to sell, and at what price. But also by the procurement/sourcing team, who determine the cost price. No big deal. They are two centralized teams that should be able to work together.
But they aren’t the only drivers of Walmart’s gross margin. There are also stocklosses, like theft/shrinkage, or waste and spoilage. These are determined by operational/supply chain efficiencies. And, controlled by store operations teams. One product at a time.
So it’s impossible to point to any part of the Walmart business and say they are wholly responsible for gross margin. Other than the CEO/divisional presidents, that is. And to manage it successfully you need to identify the true levers. Allocate responsibilities, and measure relentlessly.
We can categorize P&L drivers into 7 different buckets:
Pricing Effects
Conversion Efficiency
Mix Impacts
Variable Expense Efficiency
Fixed Expense Dilution
Marketing/Sales Efficiency
Volume
Let’s take each in turn:
1) Pricing
When we talk about pricing, we don’t just mean sales pricing. But input pricing too.
And most importantly the relationship between the two.
The extent to which pricing is a ‘lever’ for the P&L will be determined by how closely input pricing and sales pricing are linked. And that will be driven by the business’s strategic position.
Let’s take two extreme examples:
A commodity product where sales pricing and raw material input pricing will be tightly correlated - a price taker
SaaS businesses where pricing is mostly independent of any input price factors - a price maker
It’s possible to build great businesses at either end of this spectrum. Or anywhere in between. It just means the value is created in other levers within the P&L. Outside of pricing. As was the case in the opening anecdote.
People assume commodity businesses aren’t good businesses. They are great businesses if you are the market leader. Look at Cargill. They are tough if you are a number 4 though. You’ve got to have cost leadership
The precise levers that control your pricing effectiveness depend entirely on your industry. But some common ones include:
Pricing Strategy/Price Architecture
List Price Changes
New Customer Incentives
Retention Incentives
Settlement Discounts
Promotional Strategy
Sales Price/Input Price Ratio (Commoditized)
Rebates, Discounts & Over-Riders
Strength of Buying Function (vs. Market)
We will explore pricing power and strategic pricing in more detail next month. We’ll dive into the finance function’s role in business strategy.
2) Conversion Efficiency
Conversion relates to the efficiency of a business in converting its inputs into outputs. It’s typically captured inside gross margin.
Let’s take an example:
A simple one-product business that buys downgraded steel bars in bulk at distressed prices for $1,500 per ton, sorts them, and resells the good bars at the market price of $3,500 per ton.
A visual representation of the gross margin for the business would look something like this:
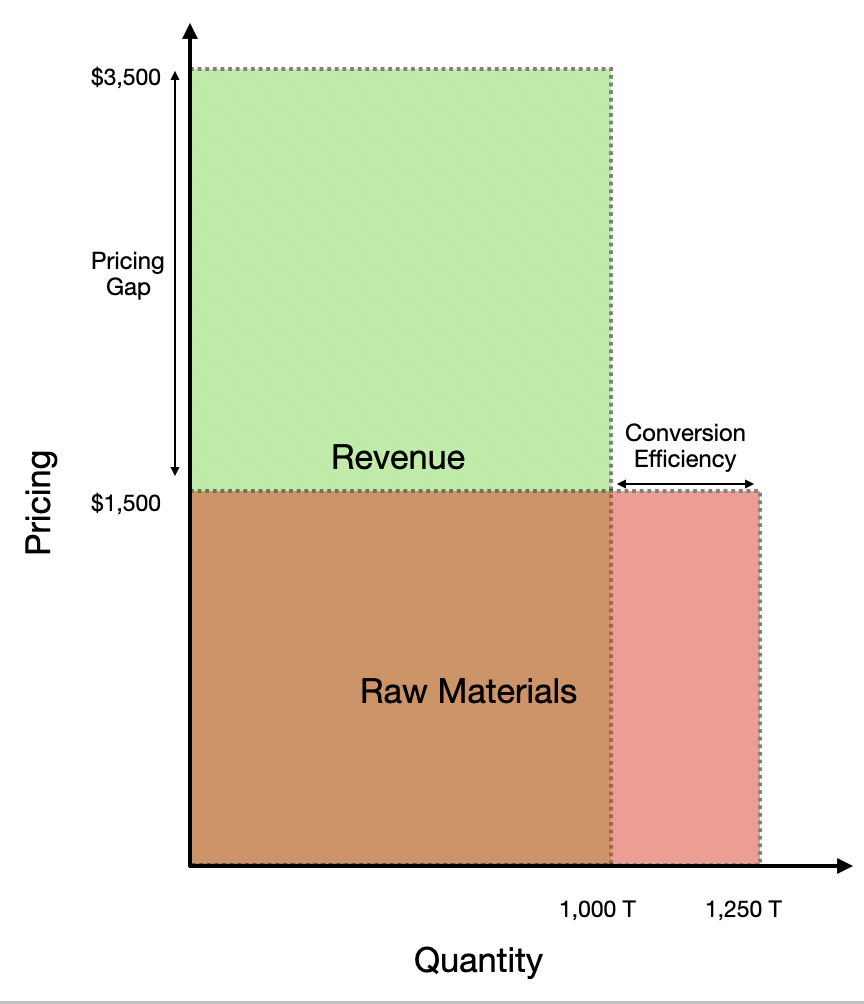
The business has bought 1,250T of steel bars for $1,500 per ton (Total Raw Material Cost: $1.875m).
Having sorted them (and finding 250T of defects) it sold 1,000T of bars for $3,500 (Total Revenue: $3.5m).
This led to a gross margin of $1.625m (the green area less the red area.)
In this simple example, there are two drivers of gross margin. One is the pricing effect, i.e. the gap between the $1,500 per ton paid, and the $3,500 per ton selling price.
The second is the conversion efficiency, i.e. the ratio between the 1,000T sold and 1,250T bought. This is a simplified single product example, in practice there are other ways to monetize the scrap.
The concept of conversion efficiency can be applied differently to different sectors. Some examples:
Industry | Pricing Effect | Conversion Efficiency |
CPA Firm | Ratio between the charge out rate, and the hourly rate paid to staff. | Utilization of staff (% of actual billed hours/potential billed hours) |
Retailer | Shelf price. Promotional price and frequency. Supplier rebates. | Level of spoilage and shrinkage |
Hair Salon | Relationship between the cost of a haircut and the hourly wage for a hairdresser | Number of haircuts delivered per day per staff |
Manufacturer | Sales price vs. input price | Defect units, wasted materials, etc. |
By breaking your margin decisions down in this way, you can control drivers more clearly, and evaluate trade-offs.
Back to our steel manufacturer.
Imagine if you had the opportunity to buy sheet steel at $1,000 per ton (33% cheaper). You would reduce defect rate, but would now need to incur more labor to manage the equipment and produce the finished bars.
This would widen your pricing gap, but also give you an increased cost of labor to recover. The net benefit of this is evaluated against the capital cost of any equipment.
The more ‘conversion responsibility’ you take into your business, the wider the pricing gap you expect. This is the fundamental premise at the heart of vertical integration strategies.
Conversion efficiencies are the unfashionable part of gross margin. It’s hard operational work. It’s also where the best operators in each industry excel - they understand most price benefits get competed away in the long run.
3) Mix Effects
So far we have only talked about single product businesses.
Very few businesses are that simple.
Let’s imagine our business selling steel bars also starts selling steel tubes at a higher price. But with a higher level of defects.
This second product has a very different margin profile from the first. You can imagine the charts above becoming 3 dimensional, with the new product on the z-axis.
Now imagine it with 5, 100, or 10,000 products. And maybe 5, 100, or 10,000 customers. All with different pricing and costs to serve.
It quickly becomes impossible to visualize.
The point is mix management is complicated. And measuring it is hard. There is a reason we hide the variances we don’t understand in the ‘mix’ column of our EBITDA bridges (don’t pretend you don’t know what I mean).

But great P&L management does require great mix management. In most businesses there are two types of mix; product mix & channel/customer mix.
Things get even more complicated when products cannibalize one another.
The number of times the sales/product team tells me this new product/range extension is 100% incremental? 100%.
Number of times it is 100% incremental?

0%.
Naturally, the tools for managing mix are numerous, but some examples:
Product Mix
Delist unprofitable products
Introduce new products (at better margins)
Cross promotions & Upselling
Bundling
Switching/cannibalization effects of the above
Customer Mix
Delist unprofitable customers
Customer margin improvement program
New customer pricing incentives
Growth incentives
Channel mix effects
Customer cost to serve
Simplifying this a little. Your goal with mix management is to increase your volumes on products with higher margins vs those with lower margins.
Of course, its rarely that simple; maybe customers want steel bars not steel tubes. Maybe they’ll only buy tubes from you, if you also sell them bars at a discount. This is where commercial strategy is everything.
And managing mix assumes you can measure product and customer margins. We will talk more about that next week.
4) Variable Expenses Efficiency
This bucket acts as a catch all for any variable operational costs that haven’t yet been controlled through buckets 1-3.
These are likely to be costs that are hard to directly attribute to individual products or customers. That could include general operative labor costs, transport costs, energy costs, computing costs, etc.
They are still variable costs because they are linked to volume; just not an individual product or customer.
These costs have been volatile in recent years with labor inflation, energy cost spikes, and global shipping backlogs.
These costs need controls over rate and usage. If you aren’t big enough to have a central buying team over these expenses, then join a buying consortium.
The other dynamic in variable expenses is the effect of automation and robotization. Upgrading of manufacturing equipment to improve efficiency and remove labor has been happening since the start of the industrial age.
However, the pace of change and extent of improvements in robotic technology over the last few years is extraordinary.
This means a mass conversion of variable costs (labor) to fixed costs (depreciation or rent). Reducing costs for those with the technology and increasing barriers to entry for those without it.
Capex inbound:

5) Fixed Expense Recovery Rate
Assuming you already have good old-fashioned expense controls in place (approval workflows, cost center management, etc.), the key to great fixed expense management is balance.
Investing in fixed expenses to replace variable costs as soon as the volume is there to support a certain level. But also being wary of demand volatility that could leave costs stranded. It’s about timing and discipline.
We covered this in detail last week.
6) Marketing/Sales Costs Efficiency
Sales and marketing costs mean very different things, in different businesses:
In a mature business, with flat top line, there may be very little marketing. And the sales team is focused on servicing existing accounts. This will behave like a fixed cost.
But there are many more situations where sales and marketing costs behave like variables costs, or even more like Capex. With heavy up front investments with long speculative payback (some examples):
In a SaaS scale-up, with $100m of VC funding in their pocket, the cost will be invested upfront in a sales team fiercely pursuing new logo acquisition. With an aggressive commission structure to incentivize the team.
Likewise in an Ecom startup, the investment is all in Facebook and TikTok ads. Customer lifetime value vs. customer acquisition cost.
In a CPG business, the cost could be TV advertising, and hard to attribute sales to.
Each of these examples has very different cashflow profiles. And levels of attribution quality.
For many businesses this is life-or-death stuff. Mastering this (and how you measure it) for your specific business and commercial strategy will be crucial to your success as a CFO.
Especially if you are in a high-growth/early-stage business.
7) Volume
The final lever is, of course, volume.
The other 6 levers and volume are circular. Buying well, operating efficiently, and selling at a lower price than your competition will drive volume. And that volume will help you buy better, operate cheaper, and so on (see the Costco model).
Likewise, if you are a lowest cost operator but keep your prices high,and invest heavily in marketing, you will grow volume. But through a very different P&L shape.
The key is to understand the relationship your business has with its volumes.
It again comes back to the relevant ranges for your current cost structure (see last week). Simple breakeven math will take you a long way inside a range. Knowing when you will break out of that relevant volume range and how to ‘reset’ is key.
Many VC-backed businesses were incentivized to grow at an unnatural pace. Fueled by ZIRP-funded war chests 50x the size their business plans deserved. This led to a cohort of businesses that had got big, without really knowing if their core unit economics held water.
And some of those businesses got big. Really big…
I’m looking at you Allbirds.
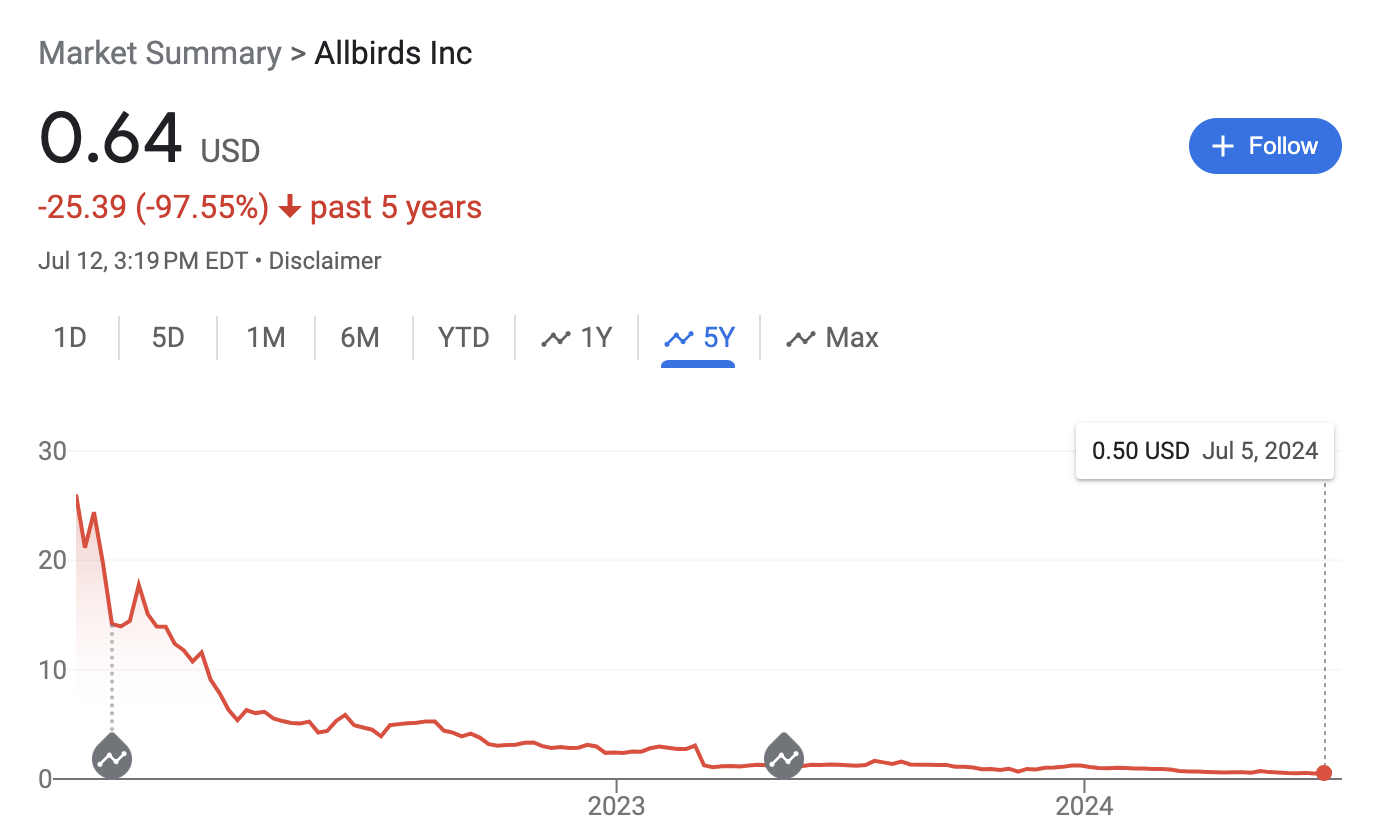
They were worth $4bn at their height. Today just $100m. Looks like their unit economics are even worse than their shoes …
Next week, we’ll get even more tactical. And talk about product costing in practice.


Break gross margin into component drivers, and measure each one
In the long run, the market will set your sales prices. But you will always control what you spend.
Huge wave of automation is coming, that will continue to convert variable expenses into fixed expenses. Prepare for the capex!


Bacon from Indiana asked:
My company is potentially on the cusp of financing a large growth capital project ($200+ million) and will have debt for the first time in my 12 years with the organization. Therefore, managing debt has not been a regular practice for the current finance team. What advice would you give in a situation like this? What areas or things are a must-focus to make sure it is managed smoothly and cleanly? Thanks!

Thanks, Bacon. I love this question. And the fact you are asking it is a good sign you are running your function in the right way.
The first thing to remember is that if things go badly, the bank can take your business. So you should have a very low tolerance for risk when it comes to compliance with requirements of the bank.
The second thing to know is that banks don’t like owning businesses. They want to lend you money, collect their interest, and watch you prosper and pay them back. Then hopefully borrow from them again for the next stage of growth. There are some lenders that are exceptions to this, but you’ll know when you meet them.
I have a series coming later on managing banks, but the key thing is ‘NO SURPRISES.’ If you think CEOs, CFOs, and Boards hate surprises, try surprising a bank.
There are three practical things you need to do if you are not already:
Understand the reporting requirements. You will likely be required to provide monthly/quarterly reporting in a certain format within a certain time frame. Make sure you are set up to deliver this.
Understand the covenants. You need to take the covenants in your loan agreement seriously. As long as you are inside your debt covenants, you are in control. The minute you breach a debt covenant, you have to rely on the sentiment of miserable, old and (often) ugly bankers. That’s not a good place to be. You need to be forecasting well, so you can see any upcoming issues in the debt covenants and manage them internally (or externally with the bank) as necessary.
Cashflow forecasting. If you are about to embark on a massive investment program, cashflow forecasting becomes more important than ever. Especially your 18-month forecast. You must ensure the organization doesn’t become complacent on cashflow when it hears you have a ton of new money coming in.
There is a lot more to say here, but hopefully, that gives you something to work with.
If you would like to submit a question, please fill out this form.

And Finally
Next week we’ll get even more tactical, and talk about product costing in practice.
If you enjoyed today’s content, don’t forget to check out this week’s sponsor Orb.
Stay crispy,
The Secret CFO
Disclaimer: I am not your accountant, investment advisor, tax advisor, lawyer, CFO, director, or friend. Well, maybe I’m your friend, but I am not any of those other things. Everything I publish represents my opinions only, not advice. And certainly is not investment advice. Running the finances for a company is serious business, and you should take the proper advice you need.

What did you think of this week’s edition?
